Agricultural resilience lies at our feet… In the soil
“In recent years, many people have had the impression that Québec is more exposed to extreme precipitation events than it used to be. This impression is well-founded, at least for the extreme south of Québec,” states a report by the Consortium on Regional Climatology and Adaptation to Climate Change (Ouranos).
We were able to visualize these changes in precipitation using weather observation data collected since 1945 by Environment and Climate Change Canada (ECCC) at the Montréal weather station (see Methodology section). Then, through meetings with farmers, we went to see how this translates on the “cow floor”.
“My father always said: the ideal is 1 inch of water (2.5 cm) per week to have a good production and something balanced,” says Mathieu Beauregard, with a laugh, knowing full well that in agriculture, so-called ideal conditions are not usual. Originally from the Montérégie region, he took over the business that had been in his family for five generations a decade ago.
Like many other producers in the region, he must now deal with extreme rainfall followed by periods of drought. Episodes that, according to those who cultivate the land, are becoming more and more intense.
Interactive graphs 1 and 2 show the total precipitation amounts for the months of May and June (in green) and July and August (in orange). Since 1945, no significant trend can be observed for the Montréal weather station. Credits: Ali Akbar Sabzi Dizajyekan.
Interactive graphs 3 and 4 show a change in precipitation distribution. The blue line graph shows the total amount of precipitation during extreme rainfall events, and the red line graph shows the number of days with precipitation above the 95th percentile of the precipitation dataset (removing days with no precipitation), equivalent to 24.7 mm. In both cases, there has been an increase in the amount of rainfall during extreme precipitation events after the 1980s. At the same time, the number of rainfall days exceeding 24.7 mm (in red) is also increasing. Credits: Ali Akbar Sabzi Dizajyekan.
Looking at the total precipitation amounts (in green and yellow), we see that the amount of rainfall has not increased. Rather, it is the distribution of rainfall that has changed. It falls in a shorter period of time and in greater quantities during the months of May, June, July and August. This observation is consistent with the trends announced by Ouranos and Agriclimat.
The agricultural community on the front lines of change
Whether it’s crop losses, lower yields or higher production costs, Québec agriculture is on the front line when it comes to the impacts of climate change.
A study on the adaptation of agricultural environments to changing climate contexts highlights the concordance between scientific data and field experience. “There is more rain in less time,” confirms Jean-François Forest, consulting agronomist and author of the Assessment of the main current climate risks on vegetable crops to identify adaptation needs and potential technologies, an analysis conducted in 2016.
Between 2004 and 2010, 75% of the claims paid to vegetable farms were associated with climatic causes, with excess rainfall being the reason for the majority of claims to the Financière agricole du Québec (FADQ). The insurer was unable to comply with our access-to-information request for data over a longer period, which would have allowed us to verify whether claims related to extreme rainfall are on the rise.
“[Extreme precipitation] could happen before, but now, even at this time of year, in a super dry year, we’re pretty sure we’re going to have to get the shovels out because we’re going to get a 3-inch (7.5 cm) storm in two hours,” says Beauregard.
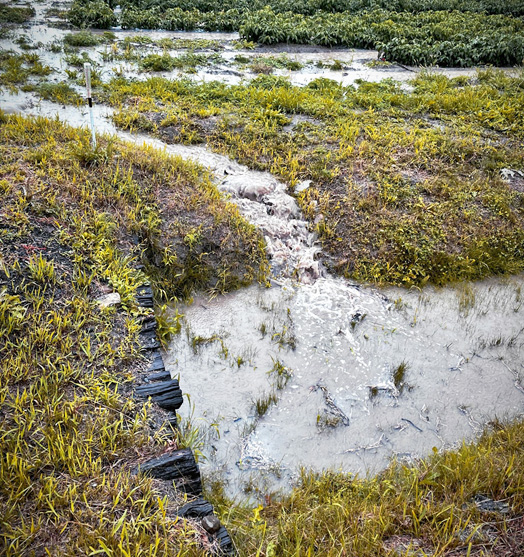
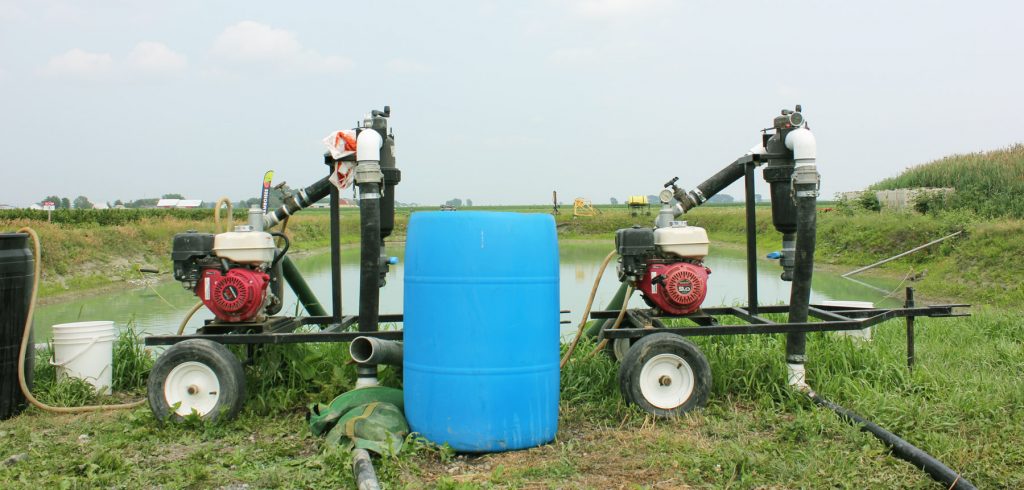
A few hours after the interview, Beauregard and his employees were taken completely by surprise: more than 25 mm of water had fallen in less than an hour! During such episodes, dry and/or compacted soil will not be able to absorb water quickly, which will create surface flooding. So everyone takes their shovels and digs channels to redirect the water to the ditches (see photograph).
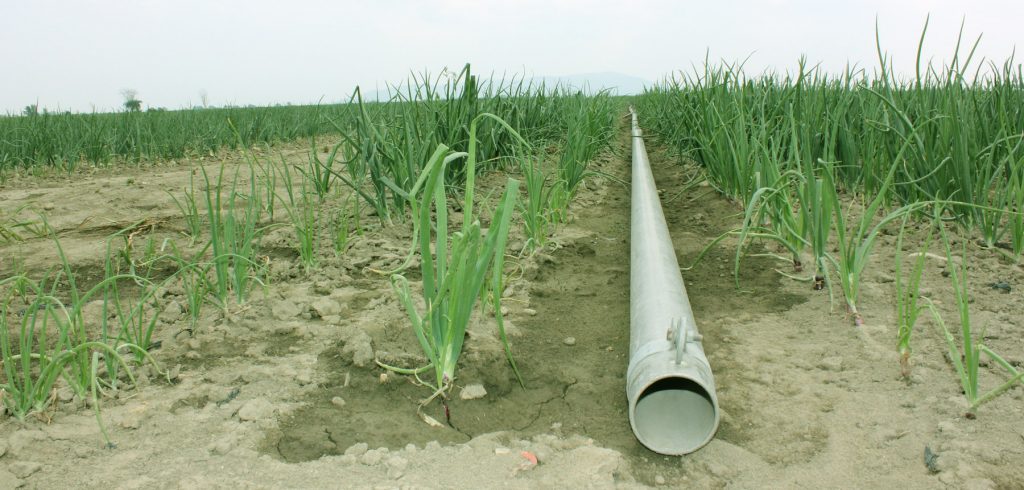
Ten kilometers away, Serge Jodoin, co-owner with his brother of a farm of more than 300 ha, also sees the consequences of the weather on his corn plants. “This year, it’s the drought, and my plants are growing irregularly. This spring, we had six or seven weeks without rain, and then we had big 20-millimeter showers, so fast that it didn’t have time to penetrate the soil.”
In addition, rising temperatures can also have an impact on water deficit events. “If the temperature increases, it increases evapotranspiration, and the plants’ need for water increases,” explains Anne Blondlot, Commercial agriculture, Fisheries and Aquaculture Coordinator at Ouranos. Evapotranspiration is a combination of “transpiration” from vegetation and evaporation of water from the soil caused by heat and sunlight.
Interactive graphs 5 and 6. The latest data from the Montréal weather station dating back to 1945 show an increase in maximum temperatures for the spring (top graph) and summer (bottom graph) months. These periods are more important in terms of plant growth. We can see that maximum temperatures are much more frequently above average (in red) for this period of analysis since the 1980s, both for the spring months (May and June) and summer months (July and August). Credits: Ali Akbar Sabzi Dizajyekan.
The decrease in snow cover in the spring also contributes to the dryness of the soil. According to Vincent Fortin, a hydrological forecaster with ECCC, “snow tends to melt earlier, as it did this spring. A pretty strong signal […] With early melting, there’s more of a chance that the soil will dry out quickly.”
Interactive graph 7. In the last month of winter, March, there is a downward trend in the amount of snow on the ground since 1955, the year data collection at the Montréal station began. The melting of the snow helps to hydrate the soil. As the snow cover decreases, it does not hydrate the soil for as long in the spring, which is one of the reasons for the spring droughts. Credits: Ali Akbar Sabzi Dizajyekan.
Paradoxical situation: between lack and surplus of water
Irrigation by sprinkling or surface irrigation, soil drainage, use of glyphosate to standardize crops: the solutions to counter the climatic hazards faced by Québec farmers are numerous, and often require intensive interventions as well as major investments. However, many experts agree that the best solution to adapt to extreme precipitation and drought is at our feet… In the soil.
In recent years, vegetable farmers have not only increased their irrigation capacities, but also their means of quickly evacuating excess water. They thus avoid surface flooding, which is the main cause of fungal diseases that can destroy entire crops.
Mathieu Beauregard considers these investments to be necessary for his 30-hectare farm. “It is essential and it pays for itself if you consider that the other possibility is to lose your crop. But it’s money we wouldn’t have to spend if we had normal years.
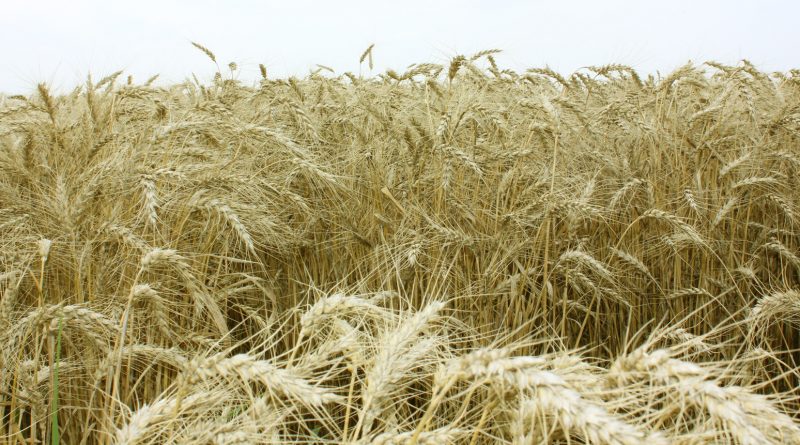
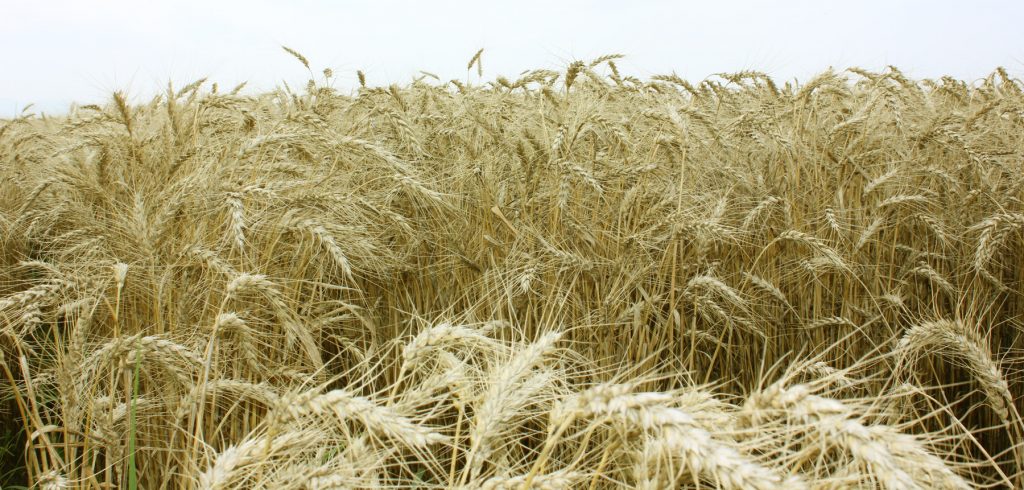
For field crops such as corn, soybeans and wheat, irrigation is not an option because the crop areas are too large and they are regularly rotated. However, to compensate for water deficits in certain areas of the field, herbicide spraying is the most common solution, to even out the crop that does not ripen at the same time. The best known herbicide is glyphosate (commercial name: Roundup).
What if the solution was at our feet?
For Louis Robert, agronomist specialized in soil health, crop heterogeneity is not only caused by drought, but also by poor soil structure. “If it were just a matter of rain, there’s nothing that would rise… But no, there are sections of crops that rise!”
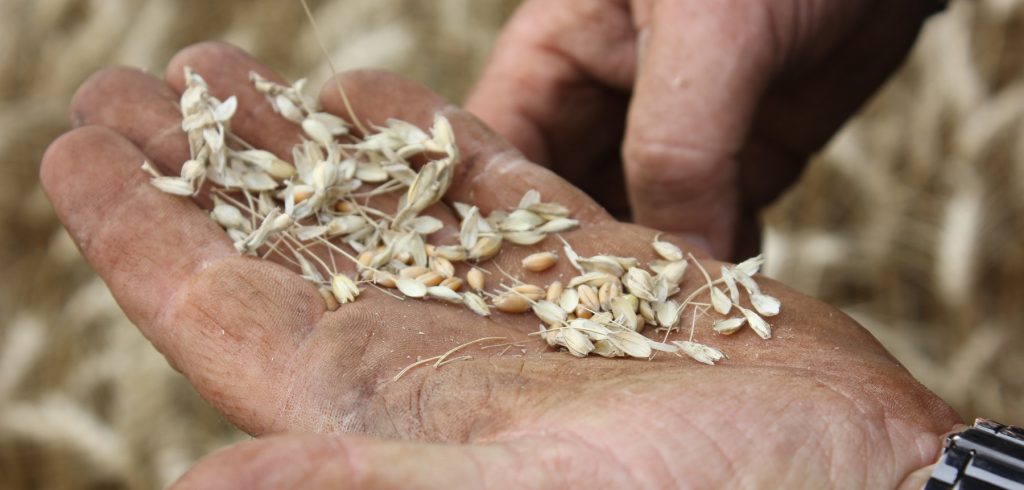
To ensure good quality, the agronomist confides that some grain buyers require the herbicide Roundup, which not only acts as a weed treatment, but also dries out the plant before harvest. For large-scale grain crops, it is crucial that the plants mature at the same time, as the quality of the crop depends on it. If plants are still green, i.e. immature, they risk wetting the entire crop.
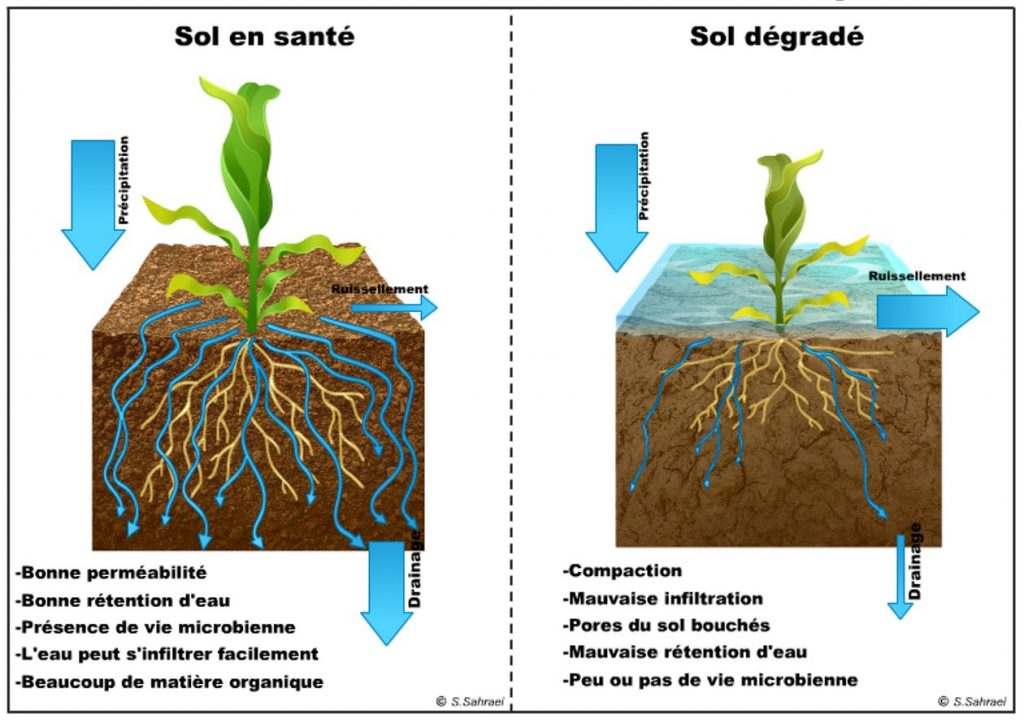
“It’s like a sponge: if you have a lot of organic matter, for example, you have a better water reserve,” explains Luc Brodeur, an experienced agronomist specialized in vegetable production.
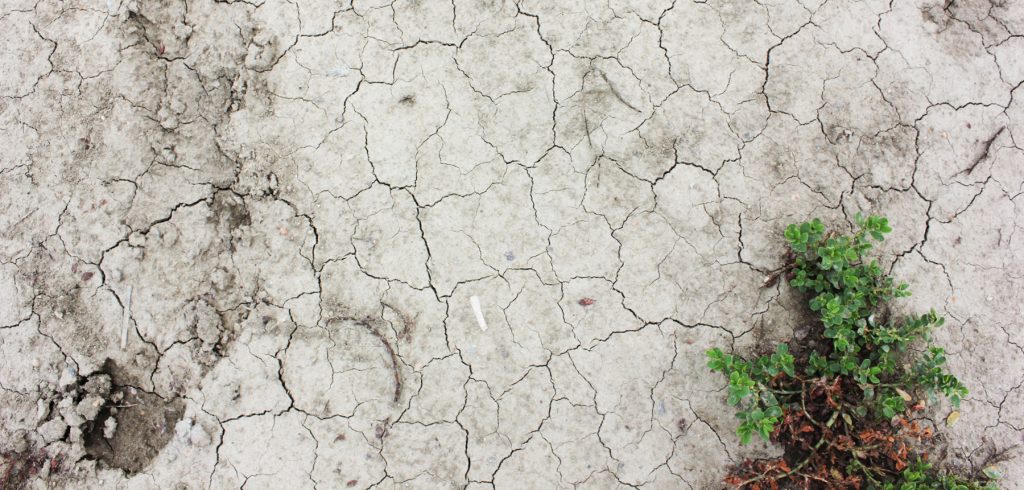
The day before, Louis Robert said in an interview almost the same thing “word for word”. For him, the solution to extreme precipitation events lies in the absorption capacity and porosity of the soil. “Soil that’s not healthy is brick in the case of clay or dust in the case of sand, and that’s something you see in droves.” He goes on to lament that the message doesn’t seem to be getting through, however, considering the increasing amount of herbicides, pesticides and heavy machinery that are being used in Québec and which contribute to diminishing microbial life and compacting the soil.
“One could say that soils in general in Québec are sick and the treatment they should be subjected to is not new, and yet we still hesitate to do it. It is even more urgent in the context of climate change because healthy soil will be much more tolerant to excess rain or drought, that’s for sure!
An observation that others agree with, according to Forest: “Our study at the beginning was based on the fact that it would probably take adapted technologies for agricultural producers to manage climate risks, but in the course of analysis and in talking to agronomists and researchers, we found that it is much more good agricultural practices that make it possible to improve resilience to climate risks!”
Performance, resilience and reduced environmental impacts
Is the myth that agricultural performance does not go hand in hand with sustainable environmental practices over?
Potager Saint-Denis, in Kamouraska, is a good example. With a market garden farm of nearly one hectare, Gabriel Gagnon and Isabelle Leblanc have reached profitability in less than four years.
“Roughly speaking, we make $30,000 to $40,000 per hectare and our expenses are minimal because we are not mechanized,” explains the couple. Gabriel admits, however, that there are some limitations to farming the way they do, which is bio-intensive, without machinery, with more than 40 varieties of vegetables, plus flowers and some green manures such as legumes and grains that, once sown, help maintain good soil quality and promote biological activity and soil structuring. “It’s certain that large producers will never have the same profitability per hectare, but at the same time, you couldn’t really do more. In fact, we could be even more productive on our hectare, yes, but we couldn’t do 15 hectares like we do here.”
However, there are some important farms in the organic sector. Luc Brodeur cites the Pur Delys farm in Saint-Isidore in the Montérégie region as an example. “It is the largest organic vegetable producer in Québec. They are all brothers and they have managed to develop extremely efficient practices!
A speech repeated many times by Louis Robert throughout his tour of Québec as part of the “Soil Health Caravan”, an initiative of a small dedicated team from the Québec Ministry of Agriculture, Fisheries and Food (MAPAQ). “At first glance, people think that increasing production necessarily goes hand in hand with increasing environmental impacts, which is not the case at all… it’s perfectly compatible […] Sometimes I hear from producers who have been working on soil health for a long time, and these are the ones who are the most profitable, that’s the funny thing!”
With more frequent episodes of extreme precipitation interspersed with water deficits linked in part to increased temperatures and decreased snow cover, farmers, unable to stop the progression of the climate, have no choice but to adapt to the predicted climate changes. For many experts, adaptation will require a better awareness of the importance of healthy soil. In addition to increasing yields, a healthy soil outperforms expensive technologies in terms of resilience to drought and surface runoff.
Methodology
Data journalism, and more specifically historical climate data journalism, is an investigative work. You start with an impression, a theory, and then you “ask” the numbers to determine if a trend is indeed reflected over time.
For example, some people say, “It didn’t used to be like this” or “Episodes like this are much more frequent than they used to be. However, it is necessary to disentangle climate variations considered normal by meteorological research, on the one hand, and real trends in climate change, considered abnormal and critical for human life, on the other.
It is now undeniable that global temperatures are rising and that this increase of several degrees is caused by human activity. To visualize the situation, one might think that one only needs to look at the temperature data and show how it has changed over time. However, other effects of climate change, although known and damaging, are more difficult to visualize because more than one factor is involved. This is the case for precipitation, which is changing at a very local scale and tends to vary greatly from one year to the next.
Choice of the weather station
The first challenge was to clarify what we were looking for. Our goal was to address issues specific to precipitation and its impacts on agriculture. But which data to choose?
First, interviews with Québec farmers, as well as with regional groups such as the Union des producteurs agricoles (UPA), allowed us to understand that rainfall issues are specific to each region. We then restricted our analyses to one region in particular. We chose the Montérégie region, because it is the most important agricultural region in Québec.
Then, our challenge was to identify a weather station that would provide us with a large enough amount of continuous data over a sufficient period of time to observe a trend. We were surprised to find that the majority of the stations analyzed – 17 in all – had a significant amount of missing data, which was problematic given our objective.
So we turned to the Montréal airport station to write the report. Why did we do this? First, because this station is relatively close to the Montérégie region, but also because it has very little missing data. Additionally, daily precipitation and temperature data have been collected there since 1945, allowing for the observation of trends over more than 70 years. The Montérégie regional stations had too much missing data to provide reliable and conclusive results.
Data setup
Many hours were spent trying to find the best way to observe a trend. For example, how do we know how many millimeters of precipitation are critical for agriculture? How many days without rain does this parameter become critical? How much rain per week would be ideal?
To answer these questions, we first consulted farmers, but the answers we received varied greatly depending on the type of soil, the region, the type of crop, etc. We then drew a broader picture by referring to the definition of “extreme precipitation” in the 2015 Ouranos synthesis document: precipitation that exceeds the 95th percentile of average daily rainfall amounts is considered extreme. For the Montréal station, this calculation corresponds to 24.7 millimeters per rainy day. Thus, anything above this number is considered extreme precipitation
Choice of periods under this study
In order to analyze the data, we filtered the precipitation by the most important months in agriculture. In terms of snow cover, the crucial months in terms of soil hydration and drought are the last months of snowmelt, i.e. March and April. Considering that at the Montréal station, the data rarely showed snow on the ground in April, we studied only the month of March, which allowed us to see that the snow cover was decreasing since the beginning of the period under study.
As for rainfall, we considered the months of May and June, then July and August separately, in order to be as precise as possible in our observations. Indeed, if we rely on Ouranos future trend results, different results are predicted for spring and summer. On the other hand, we excluded the months of March and September, because although they are part of the spring and summer seasons, they are less significant for agriculture and therefore less relevant for the visualizations in this report.
Finally, for consistency, we applied the same reasoning to the temperature analyses.
Definition of the “growing season”
The concept of “growing season” is based on the Canadian government’s definition of “growing season” and AgriNetwork’s agro-climatic indices. The growing season varies depending on factors such as temperature and crop type, so we have used this concept as a guide, but not as it stands. Our “growing season” includes the months of May, June, July and August, when temperatures are generally above 5 degrees Celsius and most plants are growing.
Limitations
The report has some limitations in terms of data analysis. First, as mentioned above, some daily data were missing – even for the Montréal station. In addition, to obtain results closer to the reality of farmers in the Montérégie region, it would have been necessary to work with several stations in this region, since rainfall is a phenomenon that can be very local. The table below shows the missing data for precipitation at the Montreal airport station.
| Year | Number of missing data |
| 1993 | 9 |
| 2006 | 2 |
| 2007 | 6 |
| 2008 | 4 |
| 2013 | 2 |
| 2014 | 2 |
| 2015 | 1 |
| 2017 | 2 |
| 2018 | 4 |
| 2019 | 1 |
The lack of hourly precipitation data also limits our analyses. For example, for extreme precipitation, 24.7 millimetres falling in 24 hours will not cause the same damage as the same number in one or two hours. To get an even more representative picture, we would have had to go further in the analysis and look at the amount of rainfall from hour to hour.
About the internship on which this article is based – A word from the course co-leader, Ha-Loan Phan, Board Member, Wikimedia Canada
The present work of the interns is a continuation of the “Environment and Climate Change Canada Weather Observations in Wikimedia Commons” project led by Wikimedia Canada (WMCA) and funded by Environment and Climate Change Canada (ECCC). Conducted between June 2019 and March 31, 2021, this project imported 100 years of weather data from 8756 stations across Canada into Wikimedia Commons and reused it in other Wikimedia projects, such as Wikipedia. By visualizing this data, IVADO “Data Storytelling” fellows Laurence Taschereau and Ali Sabzi are helping to raise public awareness of global warming and its effects on life in Canada.
Laurence Taschereau will be entering her final year as a journalism student at the Université du Québec à Montréal in the fall of 2021. Before entering the news business, she studied law at Université Laval and worked in the wine industry as a sommelier. She has always been interested in environmental issues and social justice, two branches of current affairs that continually intersect. As a journalist, she aspires to democratize her content by making it accessible and understandable, in order to raise awareness among a wide audience. Aside from an introductory course in data journalism, she had never worked on a story involving raw data. So she went into this venture with much to learn, but even more to gain by adding this string to her journalistic bow.
Ali Sabzi is also entering his final year of the professional master’s degree in engineering and data analytics at Polytechnique Montréal. Before starting computer engineering, he studied petroleum engineering up to the master degree in Iran and France. He then worked as a production engineer in Iran. Therefore, he has experience in the use of massive data, having worked in the oil and gas industry for many years. Going from fossil fuel to environmental and climate change science, what a turnaround after all! The main difference between this internship and his previous work experience is that, in this project, he was called upon to integrate different programming and web development technologies.
Read Climate inequalities that make you insomniac by the same authors