Climate inequalities that make you insomniac
If anything stands out in our data analysis, it is the decrease in temperature differences between day and night. Incidentally, this thermal amplitude, is more or less great according to the vegetation cover protecting the neighbourhoods.
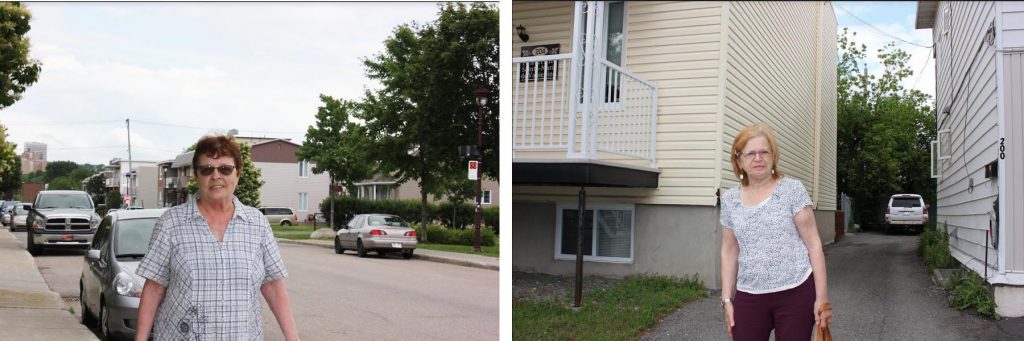
2:30 p.m., Québec City – Gabrielle and Ginette, both in their seventies, arrive at 204 Gauvin Street, sweating, for their monthly coffee meeting at the Fraternité de Vanier. Is it also possible that they did not sleep well after a hot night? One might think so, because if anything stands out in our data analysis, it is the decrease in temperature differences between day and night. Incidentally, this thermal amplitude is more or less great depending on the vegetation cover protecting the neighbourhoods.
The topic of the June meeting: Living with the extreme heat. “It is an appropriate topic for discussion today, anyway” says Ginette, somewhat exasperated, as she runs her hand through her damp hair to give it some volume. That day, Environment and Climate Change Canada (ECCC) data showed a temperature of 25.3°C at the Jean Lesage weather station, located in a vacant lot on the edge of the Québec City airport. However, it is clear that it is much warmer in the residential area of Vanier, surrounded by an industrial park to the west and north, and a commercial area to the east.
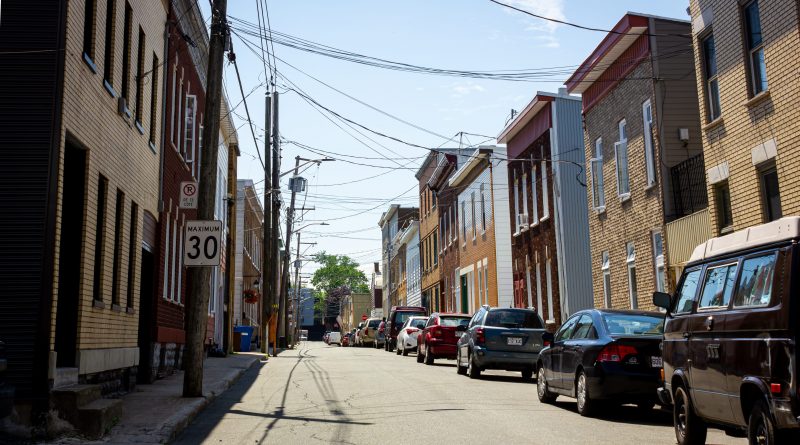
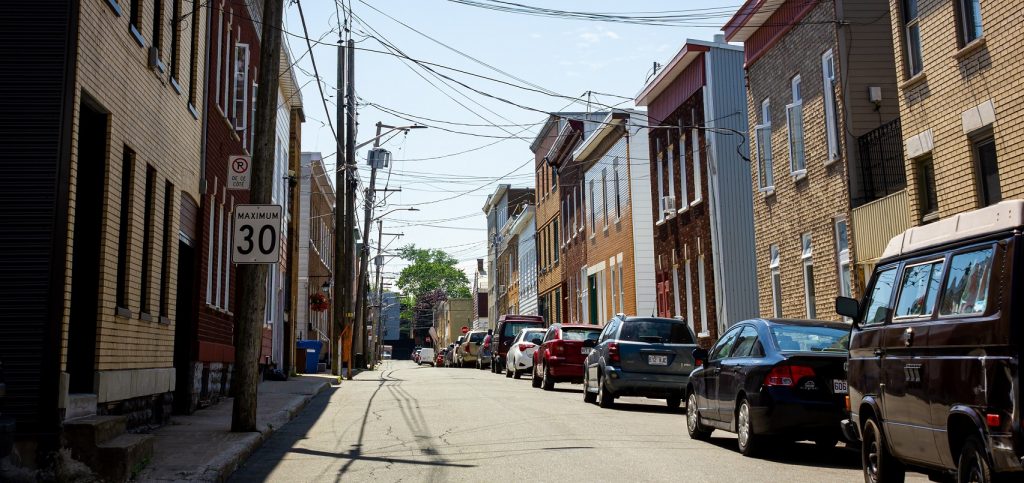
Saint-Sauveur, Saint-Jean-Baptiste and Vanier are among the most heavily mineralized(asphalt, concrete, brick, etc.) neighbourhoods in the city, and the lack of greenery gives way to numerous urban heat islands (UHI). According to the Institut national de santé publique du Québec (INSPQ), a heat island is a “temperature difference observed between urban areas and the surrounding rural areas”. This definition is associated with large Canadian cities such as Toronto, Montréal and Vancouver, which are home to densely populated neighbourhoods where the industrialization era has left its mark on districts formerly inhabited by low-income working classes.
ECCC has been collecting data since 1965 at the Jean-Lesage station, the reference station in the Capitale-Nationale region selected by the INSPQ to determine when an extreme heat wave is occurring.
Thanks to these data and those obtained from temporary weather stations in the four corners of Québec City installed in 2011 by the Government of Quebec2, we were able to visualize the significant temperature differences between the lower-income neighborhoods and the Jean-Lesage station, which is located in an environment considered as rural.
Unequal heat, unequal consequences
Québec City is among the top performers in terms of its canopy index, i.e. the proportion of tree tops visible from the sky. With an index of nearly 32%3, compared to Montréal, which does not exceed 25%4, the provincial capital is not in the spotlight in terms of UHI control.
However, the problem persists, because the greenery and the urban forest are far from being equitably distributed on the territory. Gabrielle’s neighbourhood, Vanier, has only 14%3 canopy cover. Thus, the heat released by the mineral surfaces causes temperatures to rise, night and day, during periods of extreme heat, leaving little or no chance for the body to cool down. In comparison, a neighbourhood such as Sainte-Foy (green line – graphs 1 and 2), also known as “urban”, with a canopy index of 21%5, shows smaller temperature differences from the Jean-Lesage station (grey line – graphs 1 and 2).
Graph 1: In 2012, there were significant temperature differences between the Jean-Lesage reference station (grey line) and the temporary weather station located in the heart of the Saint-Sauveur district (red line). We present these temperature differences for the year 2012 only, as some of the data were only available for half of the summer 2011 and summer 2012. Credits: Ali Akbar Sabzi Dizajyekan.
Graph 2: The differences between Jean-Lesage (grey line) and Saint-Sauveur (red line) are even greater for minimum temperatures, which are mostly associated with nighttime temperatures. Credits: Ali Akbar Sabzi Dizajyekan.
These temperature differences are caused in part by the high presence of mineralized surfaces. Asphalt and concrete have a high capacity to absorb heat; it keeps the temperature higher than vegetated surfaces, which release coolness through water evaporation.
“I have diabetes and a heart condition, I don’t have an air conditioner, so for sure when it’s hot, I can’t do much. I forget about cleaning and cooking, I do crossword puzzles and watch TV with cold washcloths on the back of my neck […] and we’re not even talking about sleeping, it’s impossible!” says Ginette, irritated, but still smiling. Gabrielle, sitting to her right, coffee in hand, agrees: “When it’s hot, it’s like everything is in slow motion. I don’t feel like anything, I’m not hungry and I’m too hot to cook”.
Map 1: This interactive map shows the location of the different weather stations in Québec City as well as the different temperature averages in relation to the Jean-Lesage reference station. We calculated these differences for the months of June, July and August. Credits: Ali Akbar Sabzi Dizajyekan.
As shown in Map 1 and Graph 3, temperatures vary on average by 2 to 3°C, depending on the neighbourhood, but the difference can be as much as 6 degrees, a difference that can have serious consequences considering that, like several other neighbourhoods with a strong heat island presence, Saint-Sauveur and Vanier are among the lowest-income neighbourhoods in the territory of Québec City, according to the most recent census available.6
“The income aspect influences the quality of housing, insulation, air conditioning, accessibility to parks, swimming pools and air-conditioned libraries,” says Dr. Pierre Gosselin, coordinating researcher at Ouranos (Consortium on Regional Climatology and Adaptation to Climate Change), and author of numerous environmental health reports for the INSPQ. He goes on to note that “98% of disadvantaged neighbourhoods are urban heat islands”.
Graph 3: The average summer temperature of the Jean-Lesage reference station for 2012 oscillates between 15 and 25 °C in the summer of 2012. Credits: Ali Akbar Sabzi Dizajyekan.
Graph 4: For the same period (summer 2012), temporary stations located in urban areas show much higher temperatures, up to 6 degrees higher than the reference station located in rural areas. Credits: Ali Akbar Sabzi Dizajyekan.
We can see that the summer temperature at the Jean-Lesage reference station for 2012 varies between about 15 and 25 degrees Celsius. On the other hand, the temporary stations show temperature differences that raise the temperature to much higher levels. Note that this is the air temperature, not the temperature felt by the body. For methodological reasons, we have chosen not to take into account the humidex factor, even though it can have a great influence on the temperature actually felt.
Credits: Laurence Taschereau.
Thermal amplitude: when the night refreshes less and less
During periods of extreme heat, an increase of just a few degrees in summer nighttime temperatures affects the health of more vulnerable people, especially seniors living in densely populated neighborhoods.
Through the analysis of the ECCC data, a decrease in the thermal amplitude is observed in graphs 5 and 6. This is defined as the difference between the highest and lowest daily temperatures. The main effect of the reduction in the range is to bring nighttime temperatures closer to those of the day, thus disrupting sleep.
“Anything that increases the minimum temperature matters because it doesn’t allow the body to have some respite [in extreme heat],” Dr. Gosselin says.
This nocturnal respite is essential, even vital. This finding has been documented by the INSPQ and is shared by Dr. Claudel Pétrin-Desrosiers, a member of the Canadian Association of Physicians for the Environment: “To a certain extent, the body absorbs some of the stress caused by heat, but at a certain point, it’s over, and this happens more quickly when you’re older because you sweat less and feel less thirst. […] As you get older, the thermoregulatory mechanisms are less efficient and the body is less able to remove heat and give signals”.
Graph 5: We observe a decrease of nearly 1°C in the thermal amplitude at the Jean Lesage station. This shows that on average, since 1965, night-time temperatures during prolonged heat periods have increased by almost 1°C . We used the INSPQ concept of “heat wave” to define a “prolonged heat period” as a period of three or more days where maximum temperatures exceed 30°C and minimum temperatures never fall below 17°C. The term of heat wave is a fairly familiar concept to the general public, but thermal amplitude remains a very little discussed effect of climate change, despite its impacts on the body and health risks. For more details, see the Methodology section. Credits: Ali Akbar Sabzi Dizajyekan.
Graph 6: We observe that the thermal amplitude during prolonged heat periods has decreased by more than 1°C over the past 20 years at the Sainte-Foy station, which is located in an urban area. This more pronounced decrease in temperature differences between day and night is an evidence that mineralized surfaces retain more heat during the day. Credits: Ali Akbar Sabzi Dizajyekan.
What at first glance may seem trivial is far from it for Dr. Gosselin, as a decrease of only 1°C at the Jean-Lesage station is exacerbated in densely mineralized areas. “We did studies for low-income neighbourhoods in every city in Québec. We asked, ‘Do you have any discomfort, mental or physical health problems?’. The results show that on a day just hot enough to have difficulty sleeping at night, not even in heat waves, 40% responded that they had experienced health problems… That’s huge!”
Amplify what’s left of the green
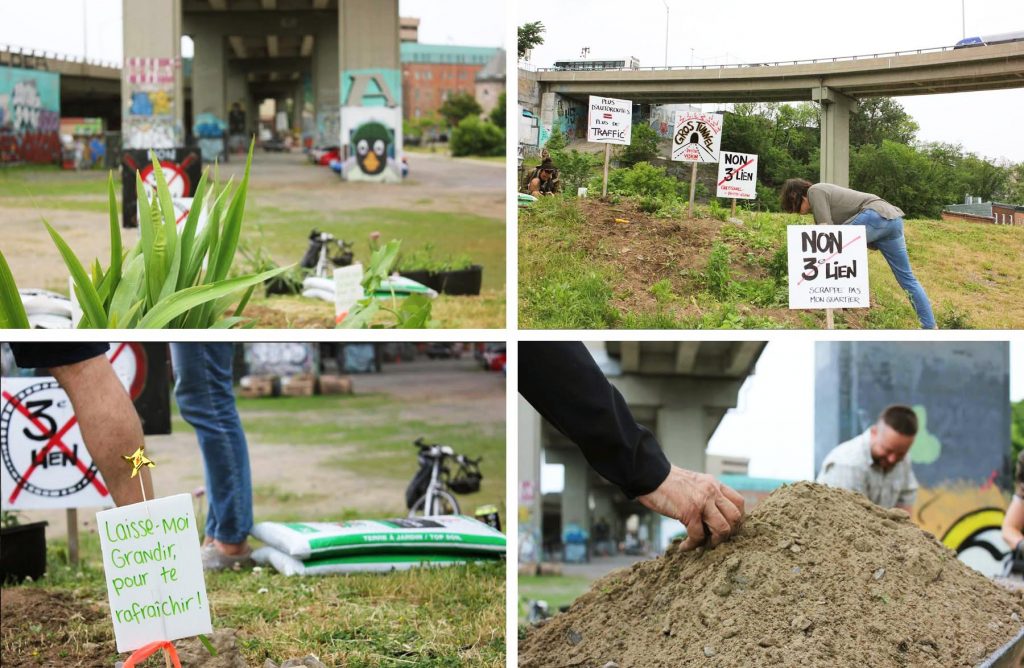
To raise awareness of the importance of conserving and enhancing green spaces, a group of citizens is mobilizing to create an “urban agriculture park”, as Vicky Plourde, a resident of the Saint-Roch neighbourhood, points out. “We want to reappropriate a vast space threatened by the third link […] Saint-Roch is a big heat island and this is an opportunity to green up”.
In fact, this project linking Québec City and Lévis by a highway tunnel threatens to lead to the concreting of several square meters of greenery in the Saint-Roch district.
For Dr. Gosselin, a physician specializing in health and climate, it is not appropriate to mineralize even more. “Instead, we should think about doing the opposite, preserving what we have. Québec City has a very low canopy in these neighborhoods, so it would be important to think about greening more”.
The City has a heat island plan in place that aims to increase the canopy index by 3% over 10 years, to 35% by 2025. In 2020, a decrease of 1% was observed, according to the most recent report presented in July 2021. In addition, due to a lack of available space, this increase is unevenly distributed. For urban neighborhoods like Gabrielle’s, a meager 15% target is being considered.
At a press conference, Mayor Régis Labeaume’s administration defended itself by stating that these percentages could even be exceeded. Furthermore, the mayor reminds us that Québec City has one of the best canopy indices. “Look at the forest and don’t look at the tree… 32% canopy in a North American city is huge. I challenge you to go and see statistically how many cities in North America that are at least the size of Quebec City have 31-32% canopy. There are certainly some, but very few”.
Challenge accepted! It is true that the vegetation in the suburbs on the outskirts of the city center helps to improve the enviable position of Québec City and is responsible for this 32%. However, the canopy index of the central neighbourhoods is comparable to those of other major Canadian cities, for example. The latest data available for Montréal, Toronto7 and Vancouver8 show that the measurement of tree and shrub canopy, based on satellite photos, is roughly the same, around 10% to 15%.
Doing the best with little
Initiatives such as Verdir Saint-Roch and Verdir Saint-Sauveur ([Greening Saint-Roch and Greening Saint-Sauveur]) have been creating respite and cool spaces for citizens for several years. “The goal is to offer additional spaces to the population,” explains Marylou Boulianne, executive director of the Société du commerce du quartier Saint-Sauveur. “People live in apartments and they don’t necessarily have a yard to cool off in”.
Thanks to a team of volunteers, several ephemeral spaces, decorated with flower boxes and shrubs, line the commercial artery of Saint-Vallier Street West. Ms. Boulianne is aware of the obstacles and physical limitations of the Saint-Sauveur neighbourhood. “We have two meters of sidewalk, after that, it’s the street […] I admit to you that we are still pretty limited in what we can do”.
For Dr. Gosselin, it is “[a] step in the right direction, but not enough […] There is a gradation in all of this… flower boxes don’t really help [in the fight against heat islands]; shrubs help, and trees are even better, but every time you demineralize, it is effective”.
With the publication of the recent report of the Intergovernmental Panel on Climate Change (IPCC), which predicts significant temperature increases in the near future, and given that the thermal amplitude is tending to decrease, especially in urban neighbourhoods, the greening of mineral surfaces and roofs is one of the avenues to be considered in order to lessen the effects of climate change on the most vulnerable: seniors living in lower income neighbourhoods.
Methodology: the background of this report on urban heat islands
One of the first difficulties was to accept that we are not experts in climate science and that despite all our good will and concern for rigor, we might ask the wrong questions of the numbers, face terminological pitfalls, and run into dead ends.
Finding our angle was a matter of trial and error. In journalism, we’re used to reporting on an event, an announcement, a news release – in short, a specific piece of information that serves as a starting point. Thousands of raw data points over hundreds of years don’t qualify as an idea funnel. While exciting, being faced with so many possibilities was confronting. Many hours were spent talking to researchers in an effort to determine if a hypothesis could be realized through the numbers. Most of the time, we were told that although a trend is observable, it is scientifically incorrect to associate it as a direct effect of climate change. So finding climate trends that are related to climate change was our first challenge.
Despite these pitfalls, we were able to find a “declining trend in thermal amplitude”, a concept we believe is not well understood by the general public and is not generally discussed when rising temperatures are mentioned as one of the consequences of climate change. Our results are the result of about 100 hours of research, interviews, and trial and error in data visualization.
We are also proud to have been able to develop a method of working and collaboration. This is our first experience with data journalism and it took longer than expected to complete because of a lack of methodology. Is it better to start by combing the literature to find a possible problem and try to see if it was reflected in the figures? Should we look directly at the data to see if a trend is emerging and then see if it is attributable to climate change? Our conclusion is neither.
In this field of journalism and science, close collaboration is required, and the course of action may depend on each individual. For our part, we remember that we must start with a scientifically recognized consequence related to climate change and adapt our reporting angle as the visualizations speak to us. For example, with regard to heat waves, it is scientifically recognized that the climate is warming, but the visualizations do not show an upward change in heat waves. So we changed the angle of the story when the visualizations showed us a decrease in heat range and our interviews with experts confirmed that this could have health consequences for the most vulnerable.
Defining a heat wave
After many interviews, we finally decided to look at the impacts of heat on health. Our first instinct was to see if an increase in heat waves was observable over the last 60 decades. The initial response was inconclusive. Not only has there been no increase in heat waves since 1965, but there have only been 9 heat waves in the Québec City area in all these years! Immediately, we thought of a parameterization error to filter the ocean of data at our disposal, because it seemed impossible to us that heat waves have not increased since 1965, considering the increase of the average temperature!
For predictive purposes, a heat wave is defined by the Institut national de santé publique du Québec (INSPQ) as “a period of at least 3 consecutive days during which the 3-day moving averages of maximum and minimum temperatures observed at reference weather stations in the health regions reach the previously defined extreme heat threshold values. For the Québec City region, these thresholds are 31 degrees Celsius and 18 degrees Celsius.
After several emails with Dr. Ray Bustinza, researcher at the INSPQ and responsible for the SUPREME alert system, a system to prevent the health impacts of extreme weather events, we discovered a crucial element to our report: the definition of heat wave as proposed by the INSPQ was not introduced in order to observe any evolution of the climate, but for the purpose of risk management for the health of Quebecers! This distinction is important for two reasons. First, by its very nature, the definition is very specific, as it must allow for the filtering of health problems and deaths uniquely related to heat and then be translated into alerts for regional and ministerial stakeholders in the public health network when risk thresholds are to be expected. This explains in part why so few heat wave episodes are recorded.
Second, this definition varies over time and across regions. Studies have been conducted across Québec to observe increases in hospitalizations and deaths, and separate thresholds have been established for all of the different health regions. With an aging population, heat wave definitions changed in 2018 to avoid including an increase in non-heat related hospitalizations and deaths.
However, the SUPREME program does not take into account aggravating factors.
Dr. Ray Bustinza, researcher at the INSPQ and responsible for the alert system, says that separate thresholds have been set for all health regions and their populations, regardless of where the heat island density is highest or demographic factors such as age and income. He explains that “the thresholds were set by studying the impacts of temperatures on health, so these temperatures, although measured in the Jean-Lesage station, represent a health risk for the entire Québec City region.
We therefore decided to make the numbers speak for themselves outside the definition of heat wave proposed by the INSPQ, as we did not intend to predict extreme temperatures, since we were already basing ourselves on historical data. Thus, we created the notion of prolonged heat period, with a definition that, although conservative, is anchored in the reality of the field by taking into account the differences in temperatures between urban and rural areas. For the the Québec City region, an extended heat period is defined as a period of at least 3 consecutive days during which the moving average of maximum temperatures observed at the Jean-Lesage reference weather station reaches the extreme heat threshold value of 30 degrees Celsius and exceeds a daily minimum temperature of 17 degrees Celsius. It was important to keep the criterion of a minimum of 3 consecutive days, because a simple increase in the number of days where the thresholds reach maximum and minimum temperatures of 30 degrees Celsius and 17 degrees Celsius respectively does not necessarily mean an increase in health risks. By using such a definition, we were able to analyze enough periods to observe a decreasing trend in thermal amplitude.
In order to use the ECCC open data, and visualize it as heat periods, extensive preprocessing with different temperature interval scenarios across the daily dataset was performed, and a moisture index analysis with hourly dataset was performed. Humidex was not considered, as it was not a scientific indicator.
The importance of the historical dimension and why Québec City
Another hurdle encountered early in the reporting process was the choice of location. In journalism, to “tell the data” you need a story. Since the goal was not to do an exhaustive and comparative study of the impact of heat across Québec (several consortia, chairs and institutes already have this mandate), we chose to focus on Québec City, because the strong presence of UHI was already known and outside of Montréal, but also because it is one of the few places where the collection of meteorological data goes back long enough and continuously enough to be able to observe trends.
This leads us to reflect on the importance of the historical dimension in scientific research. One of the important observations we made during our work for this report is the following: although many studies present climate projections for the next few decades, very often, we have come up against a lack of data allowing us to go back far enough to evaluate a theory. The question is whether today, enough steps are taken to collect and store a maximum of climate data and to make them available to actors who can use them.
For example, we were greatly disappointed to realize that data to study temperature differences (dT) between the Jean-Lesage reference station and the different neighborhoods of Québec City were only available for a few months, as they were collected from mobile and temporary weather stations set up by the Québec Government. The temperature data from the temporary Québec Government stations was a useful source. Processing this data and combining it with the ECCC data allowed us to understand the significant temperature variations in Québec City. However, it would have been even more relevant to have access to several years of data to observe changes, or not, in dT.
We therefore ask the following question: if the installation of temporary stations in 2011 on the territory of Québec City (year of the beginning of the study conducted by the Québec Government on temperature variability in urban areas) had been permanent, would we be able to have more granular data allowing for heat wave alerts adapted to each neighborhood?
About the internship on which this article is based – a word from the internship co-lead, Ha-Loan Phan, Board Member, Wikimedia Canada
The present work of the two interns is a continuation of the “Environment and Climate Change Canada Weather Observations in Wikimedia Commons” project led by Wikimedia Canada (WMCA), and funded by Environment and Climate Change Canada (ECCC). Conducted between June 2019 and March 31, 2021, this project allowed the import of 100 years of weather data from 8756 weather stations across Canada into Wikimedia Commons and its reuse in other Wikimedia projects, such as Wikipedia. By visualizing this data, the interns, Laurence Taschereau and Ali Sabzi, IVADO “Data Storytelling” fellows, contribute to increasing public awareness of global warming and its effects on life in Canada.
The 100 years of data were used as a starting point to report on the changes in climate that have affected the health of Canadian city dwellers over the past few decades and to make the information available and accessible to the general public. To do this, they chose to focus on the heat island issue in one particular city, Québec City. The interns, being free to choose their topic, considered that presenting the data through a small-scale story would appeal to readers more than giving a global picture of the situation. The only constraint of this internship was to highlight the ECCC dataset.
The original ECCC data includes monthly, daily and hourly temperature, precipitation and wind data collected from 1840 to 2018. However, for some stations, data were missing or non-existent leaving gaps of several years. Moreover, the data uploaded in Wikipedia Commons are monthly and almanac, so the interns had to import the daily data available at the Jean-Lesage station manually. The data set in Wikipedia commons represents a total of 4.5GB with a total of 26 million values.
Laurence Taschereau will be entering her final year as a journalism student at the Université du Québec à Montréal in the fall of 2021. Before entering the news business, she studied law at Université Laval and worked in the wine industry as a sommelier. She has always been interested in environmental issues and social justice, two branches of current affairs that continually intersect. As a journalist, she aspires to democratize her content by making it accessible and understandable, in order to raise awareness among a wide audience. Aside from an introductory course in data journalism, she had never worked on a story involving raw data. So she went into this venture with much to learn, but even more to gain by adding this string to her journalistic bow.
Ali Sabzi is also entering his final year of the professional master’s degree in engineering and data analytics at Polytechnique Montréal. Before starting computer engineering, he studied petroleum engineering up to the master degree in Iran and France. He then worked as a production engineer in Iran. Therefore, he has experience in the use of massive data, having worked in the oil and gas industry for many years. Going from fossil fuel to environmental and climate change science, what a turnaround after all! The main difference between this internship and his previous work experience is that, in this project, he was called upon to integrate different programming and web development technologies.
Read Agricultural resilience lies at our feet… In the soil by the same authors